
Looking back on modern history, where are we in financial economic terms?
These four charts explain can help you figure out where we are.
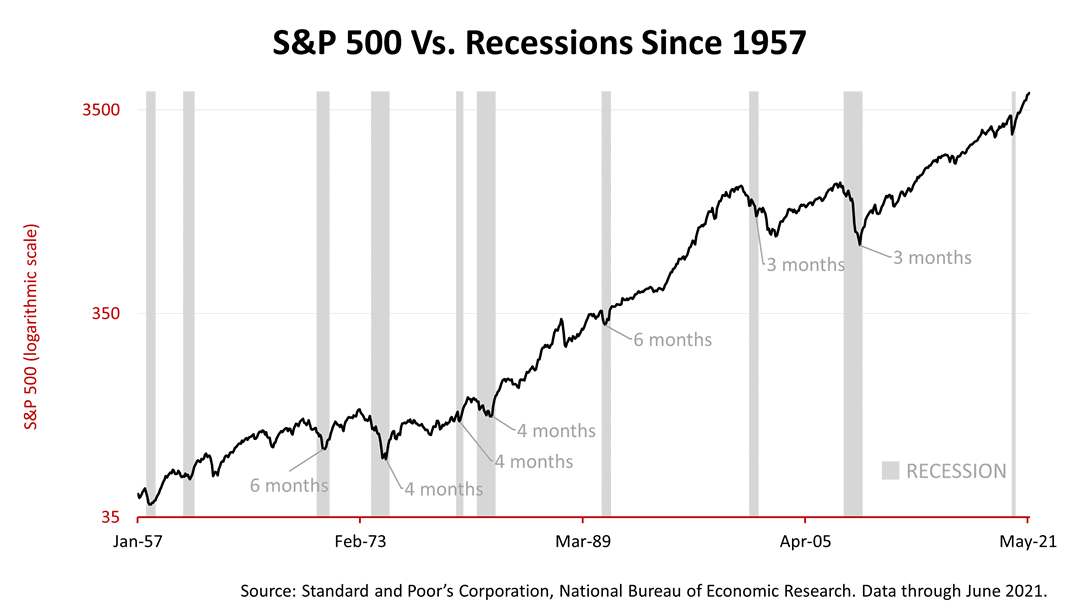
In the post-War era, major declines in stock prices are highly correlated with recessions, and stock prices generally bottomed months before the end of recessions. At present, no recession is on the horizon. It's quite the opposite: the fundamental measures of the economy are all strong.

Retail sales in America, excluding gasoline sales because of their volatility, in the 12 months ended June 30, 2021, surged by +16.6%!
The increase in retail sales was six-tenths of 1% higher than at the end of May.
The 12-month growth in retail sales excluding gasoline for the 12-months ended May 31, 2021, was an astounding +25.7%.
The 12-month rate of retail sales growth excluding gasoline is slowing but remains near record levels, much better than had been expected.
The monthly retail sales reports from the Census Bureau principally measure sales of goods. They are not a good measure of sales of services. Total retail sales account for 30% of the U.S. economy. The service sector comprises 89% of the economy.
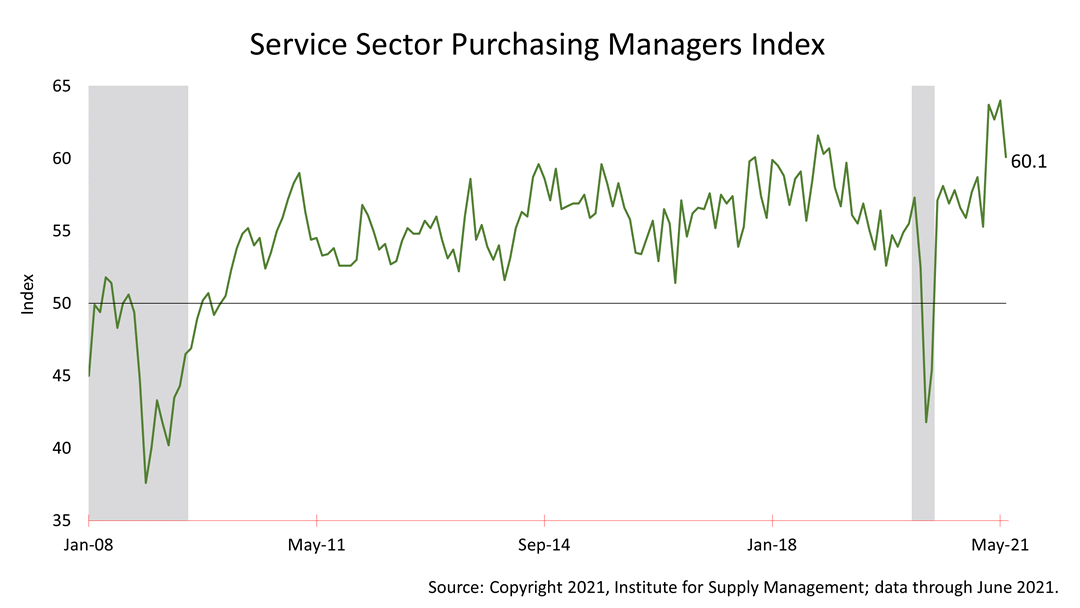
This measure of service sector growth, as reported last week, was very strong through the end of June. It is a survey of corporate purchasing managers conducted monthly by the Institute for Supply Management, a private trade group and professional certification body.
This index is comprised of 10 components and a key component is a survey question of new orders. That component (not shown in this chart) -- was at 62.1, which is very strong and an indication of what’s ahead in the coming weeks.
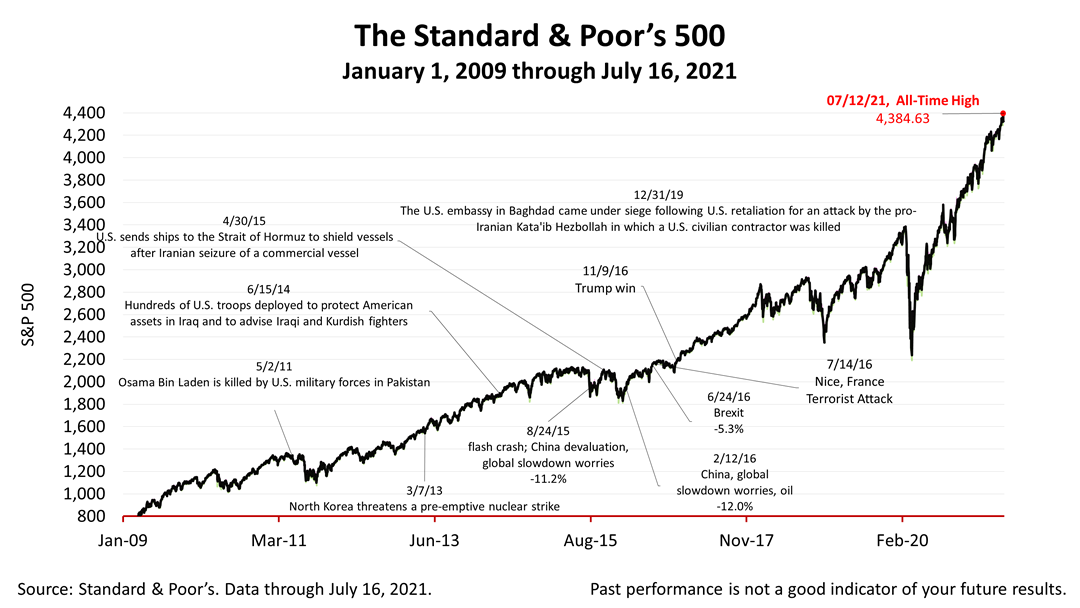
The Standard & Poor’s 500 stock index closed this Friday at 4,327.16. The index lost -0.75% from Thursday and -0.97% from last Friday, when prices closed at an all time high. The S&P 500 for the three previous weeks had closed at record highs. An index of progress in the world’s No. 1 economy, the S&P 500 is up +63.66% from the March 23, 2020, bear market low.
This website uses cookies for navigation, content delivery and other functions. By using our website you agree that we can place cookies on your device. I understand
