
In a perfect world, investors would not pay any attention to weekly ups and downs of the economy and stock market.
Of course, the world is far from perfect; human nature is to be curious and try to understand what’s happening. Financial news outlets vie for clicks and are not omniscient. Which is why, as professionals, we feel obliged to provide a weekly update about the economy and investing.
This week important data was released. The U.S. economy remains stronger than expected but not so strong that it will be difficult for the Federal Reserve Bank to manage. It’s a Goldilocks economy – not too hot or too cold.
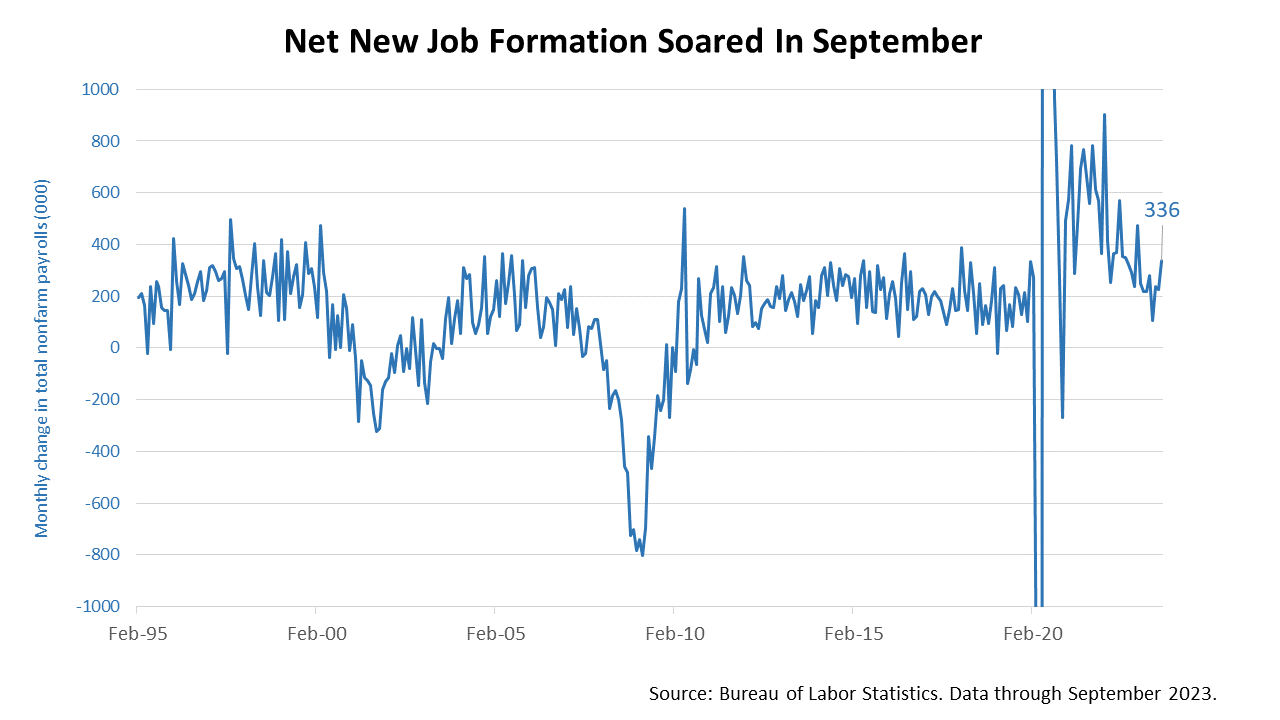
The economy netted 336,000 new jobs in September, nearly double the 170,000 expected. That’s a hot jobs number. As a point of reference, about 200,000 new jobs were added during economic expansions over the last three decades.
However, wage growth slowed and is not an inflation problem, and the service sector, which accounts for 89% of U.S. economic growth, weakened slightly.
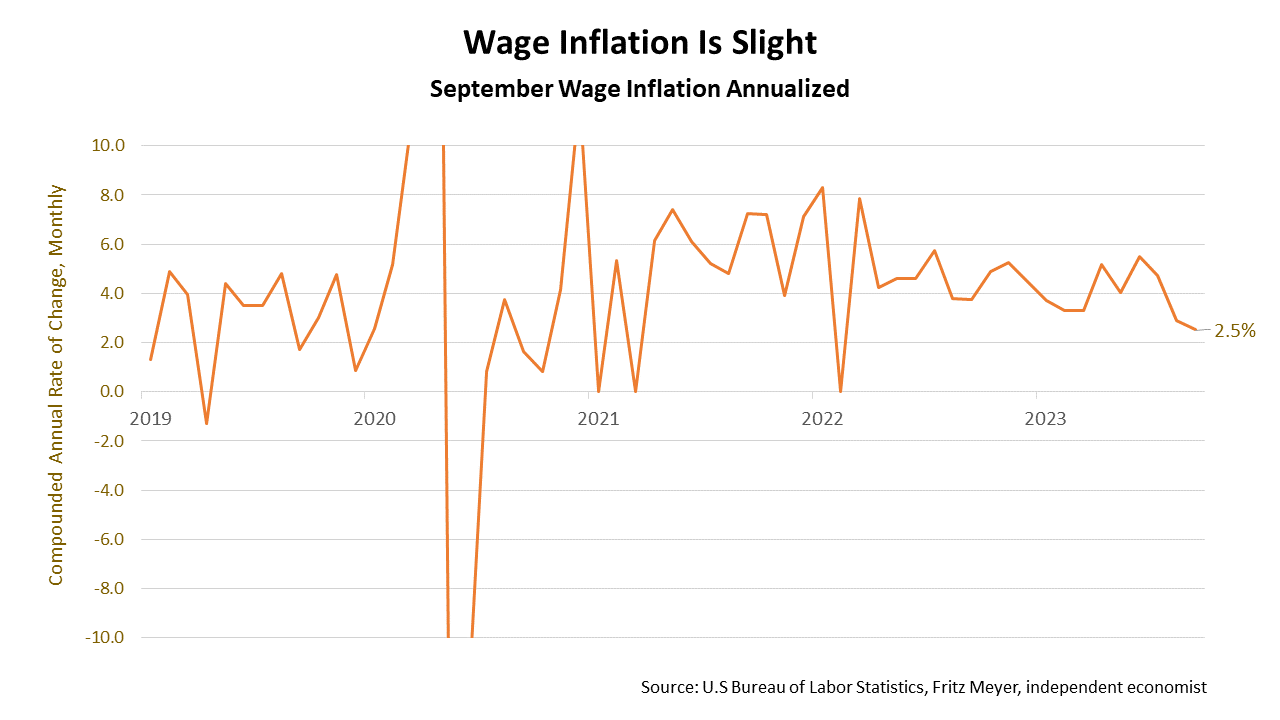
Average hourly earnings rose 4.2% in the 12 months through September but rose by 2.5% in September. Considering that worker A 2.5% annualized wage inflation rate is very good news amid a hot jobs market.
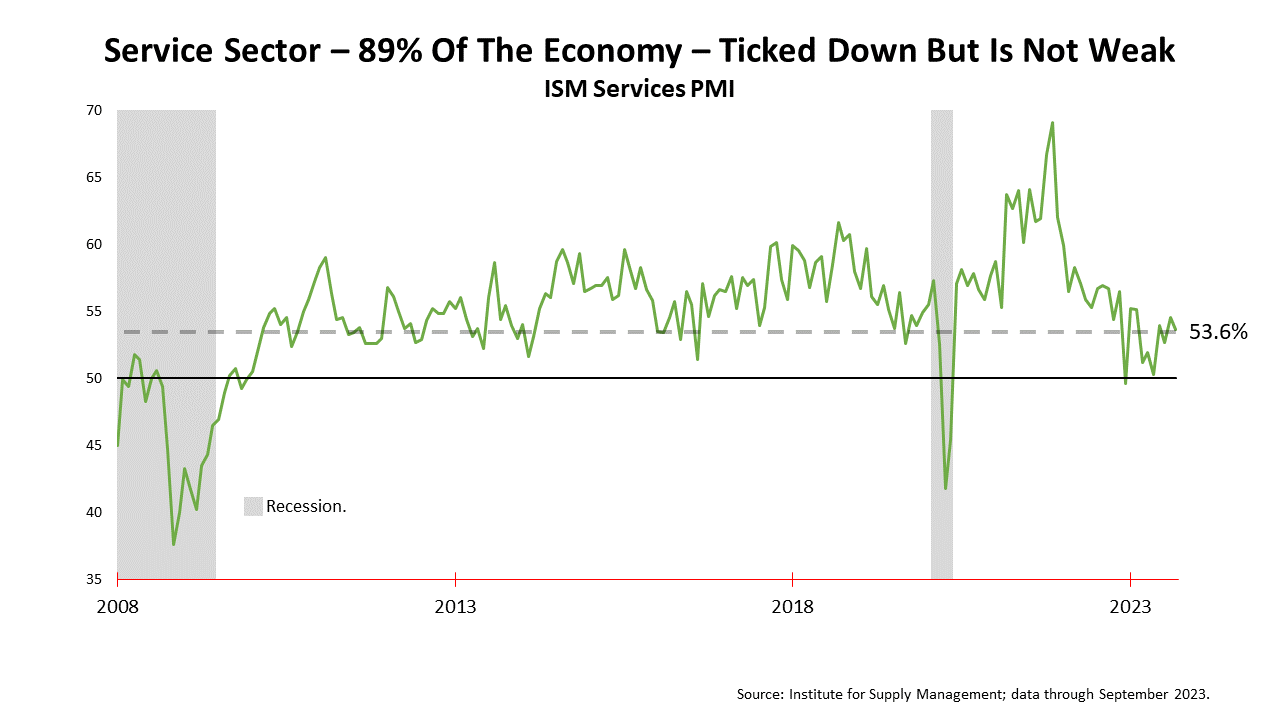
This data series began in 2008. The Institute of Supply Management surveys purchasing managers at large companies monthly and a reading above 50% indicates that the services sector economy is generally expanding; below 50% indicates a contraction. The 53.6% reading in September shows the service sector is in line with the normal level of the last expansion.
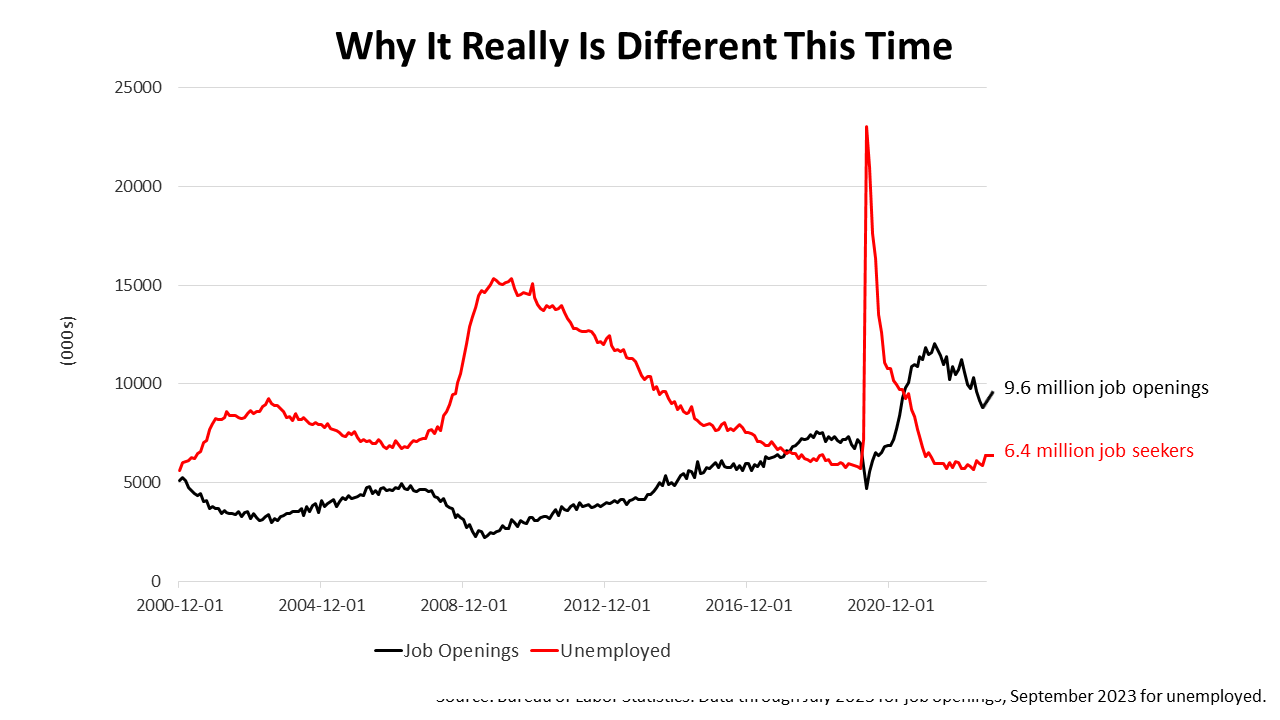
This is the most important chart this week. It shows job openings versus the number of job seekers -- the unemployed.
The number of job openings increased to 9.6 million on the last business day of August, the U.S. Bureau of Labor Statistics reported Tuesday, much more than the 8.8 million expected by Wall Street. And the number of unemployed was unchanged.
Historically, job seekers outnumber job openings, as illustrated in the black line running below the red line for most of the past two decades. However, since the pandemic, the black line’s been considerably higher than the red line. The gap has narrowed in the past year but moved much higher in August and the job market remains tight.
Labor market strength makes the Federal Reserve likely to keep lending rates higher for longer, which could lower stock prices in the near-term but makes a soft landing easier or it could mean there will be no landing and the expansion will continue.
The economy’s strength amid the highest interest rates in two decades continues to surprise economists, consumers, and investors.
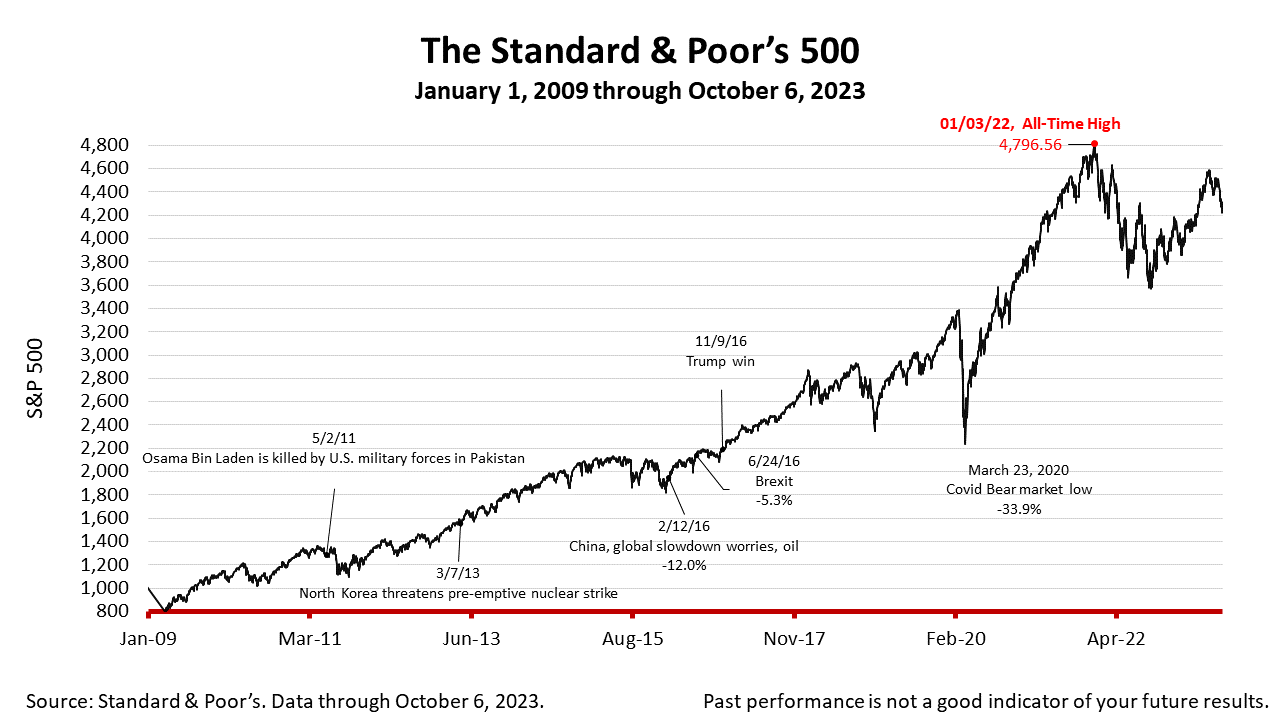
The Standard & Poor’s 500 stock index closed Friday at 4308.5, up +1.18% from Thursday, and up +0.48% from a week ago. The index is up +92.57% from the March 23, 2020, bear market low and down -10.18% from its January 3, 2022, all-time high.
The Standard & Poor's 500 (S&P 500) is an unmanaged group of securities considered to be representative of the stock market in general. It is a market-value weighted index with each stock's weight proportionate to its market value. Index returns do not include fees or expenses. Investing involves risk, including the loss of principal, and past performance is no guarantee of future results. The investment return and principal value of an investment will fluctuate so that an investor's shares, when redeemed, may be worth more or less than their original cost. Current performance may be lower or higher than the performance quoted.